STACK VS. HEAP: Why it matters in Notes
Excuse me for the pedantic nature of this post, but I recently had an issue with developing a fairly complex agent for Notes coded in Java that caused me to revisit a basic understanding of how Java in Notes works. You see, the Java Virtual Machine, JVM for short, is essentially a stack-based emulator that runs bytecode compiled from the Java language source. Without getting into too much detail, the JVM has two memory pools to speak of, the stack and the heap, that can impact the performance and reliability of your Java program. The heap is where Java stores the expanding and contracting soup of objects any given Java program creates. Often, Notes Java programmers run into memory issues when calling too many native Notes classes from within Java, which merely reference native C objects. Not following best practices in ensuring that the objects are called as efficiently as possible and dereferenced properly can cause a program to eat away at the available resources assigned to the heap. (Best practices in this case being defined by the authority on the subject and originator of the Java Notes classes, Bob Balaban.) This is commonly referred to as a memory “leak” and will eventually cause the JVM to crash, if the program doesn’t terminate before the leak becomes fatal. Now, how this applies to my particular problem is precisely nothing: After compiling and running a program that does indeed use the Notes backend classes, running it flawlessly using Bob’s two-headed beast method and importing it into Notes, it would mysteriously die with a Java.lang out of memory error. Going through the excruciating, but very cool process of installing, running and staring at the results of Eclipse TPTP until my eyeballs hurt to analyze the memory usage, I determined that the Notes backend classes –as I had expected- were not unduly taxing the system. They were not taxing the system at all, in fact, as I was reusing an extremely limited number of Notes objects and not creating new ones arbitrarily –in effect I was practicing good object hygiene. Thus all the tips&tricks pouring in from my lazyweb twitter request and nagging of old acquaintances centering around increasing the Notes JVM heap size at runtime had no effect. It wasn’t the heap that was the problem.
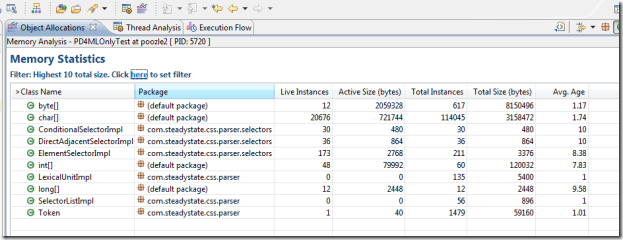
As you probably surmized by now, the answer lay in the JVM’s stack. Each thread in the JVM gets it own stack, a last in, first out (LIFO) piece of memory that handles local variables and such for the thread. (See Java VM Spec, scroll down to section 3.5.2) Highly recursive calls tend to fill up this type of stack pretty quickly. I did notice in my tptp reports a disproportionate amount of char and byte arrays being instantiated and –upon further tracing and asking around- learned that a third-party library I am using to convert HTML into PDF (PD4ML, highly recommended, BTW) would under a particular circumstance make use of the Java JAI classes to render images in a highly recursive manner. The JAI classes are quite good about cleaning up after themselves, but they do seem to need more room in the JVM’s stack than the default 409600 bytes that the Notes client assigns for anything more than trivial use cases of JAI. Increasing the stack size in the Notes client using the notes.ini variable JavaStackSize neatly solved the problem. Stress-testing the agent with 2500% of the previous load that caused a JVM failure proves out the theory that the the JAI calls just needed a little more headroom to run (I can empathize with that) and a more pernicious leak wasn’t the issue. Problem solved, crisis averted and sanity restored. Thank you for listening.
Oh, and getting Windows Live Writer fully functional as a blog posting tool using the Drupal BlogAPI, XML-RPC and WLW’s nifty image editing sauce (check out the drop-shadow on the screenshot above) is uber-rewarding.
